Scenarios
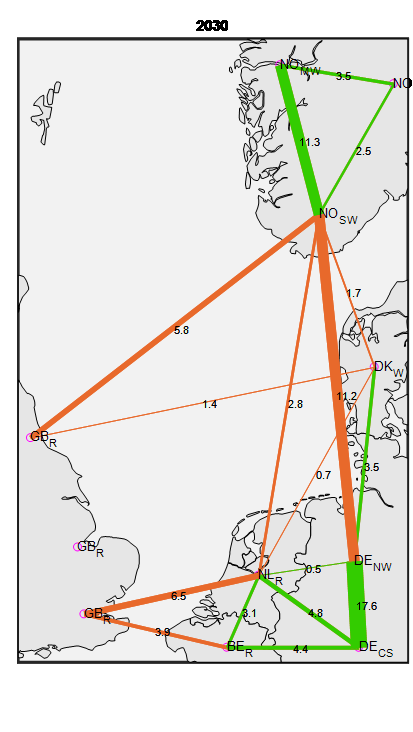
Transmission lines in 2030 (GW) (Koivisto et al., 2019b): Onshore lines in green and country-to-country offshore lines in orange.
In order to identify, develop and validate wind farm control strategies for future power and energy systems, it is important to model the future energy market, operation and scenarios. Future energy scenarios are simulated as investment optimisation for 2020 and 2030 based on Koivisto et al. (2019b), the NSON report on enery system scenarios, and the NSON report on day ahead market operation.
Meteorological year data from 2012 is used for these simulations. The scenarios are based on an investment optimisation of the generation and transmission capacity for North Sea countries. Scenarios with both radial offshore connections of WFs to the grid as well as meshed offshore grids are considered in the investment optimisation. However, only the scenarios with radial connections are included in the FarmConners market showcases. The resulting transmission lines in the North Sea region for 2030 are depicted in the figure on the right. As shown, the level of interconnection between the studied countries is high, especially to Norway. Connections with Norway proved to be crucial in the simulations where Norwegian hydro power was not only used to cover the domestic demand, but also to provide flexibility to its neighbours. More details are provided in the NSON report on enery system scenarios.
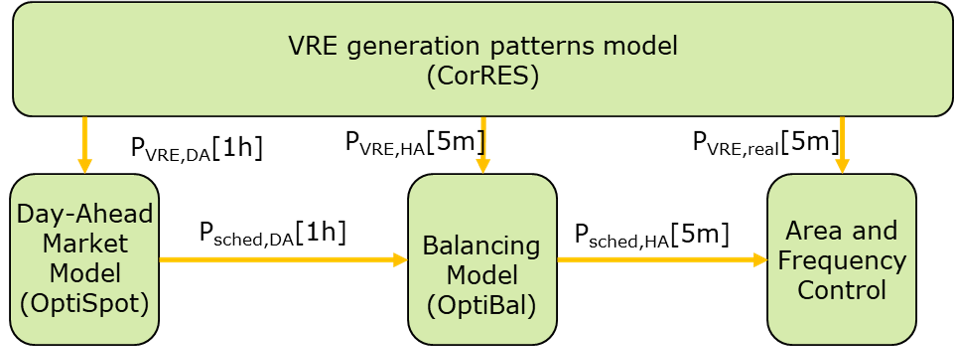
DTU Wind has developed the DTU Balancing Tool Chain consisting of CorRES, OptiSpot, OptiBal, and Area and Frequency control model to analyse market and balancing operation in future energy scenarios (Das et al., 2020, NSON report on balancing tool chain).
Simulating the large power systems does not only include unit commitment but also operational planning constraints such as yearly hydro scheduling, scheduled maintenance, and heating constraints (NSON report on day ahead market operation). The scenario simulations include different generators of Variable Renewable Energy (VRE), but only wind power is considered here. All wind power generation is aggregated at the market area level and considered as price maker. The spot market practices are assumed to remain similar to today. It has been observed that wind power plays a major role in dictating the electricity prices mainly in the 2030 scenario when the share of renewable energy is high. The FarmConners market showcases use the obtained price signals as an input for WFFC, where the reference wind farm acts as price taker. It is assumed that each WF is acting on its own, without coordination of several farms having the same owner. As mentioned earlier, the electricity price signal for DK1 is considered for the showcases.
Balancing principles followed by the Danish Transmission System Operator (TSO), Energinet, are implemented for the considered scenarios, to simulate the volume of up-regulated and down-regulated power, as well as the prices for up-regulation and down-regulation (NSON report on the balancing tool chain).
In future, the wind farms are expected to act mainly on spot and balancing market prices. However, external signals from the TSO are sometimes obtained in lieu of disturbances/congestion in the power system. As per today’s practice, these signals can be converted into different control modes such as delta control, balance control, ramp rate limitation (Hansen et al., 2006). These situations are considered as TSO-driven cases in the Market Showcases.
The steps of the scenario simulations can be summarised as: 1. CorRES simulates an hourly time series for the aggregate Variable Renewable Energy (VRE) generation sources in each analysed European region. The simulations include time series for day-ahead (DA) power forecast (\(P_{\text{RES,DA}}\)), hourly-ahead (HA) power forecast (\(P_{\text{RES,HA}}\)) and available power (\(P_{\text{RES,real}}\)). 1. OptiSpot, which is implemented in Balmorel, uses the DA forecast from CorRES (\(P_{\text{RES,DA}}\)) to simulate the unit commitment and schedules the hourly behaviour of the entire power system in the DA spot market (\(P_{\text{sched,DA}}\)). This results in hourly DA prices for each region as well as power plans from different generators of which only wind power is used in the showcases. 1. The OptiBal HA runs (also implemented in Balmorel) are based on the DA market plans (\(P_{\text{sched,DA}}\)) and updated HA forecast (\(P_{\text{RES,HA}}\)) to mitigate the imbalance prognosticated in each control area. This results in simulated balancing prices and regulating power in each control area (\(P_{\text{plan,HA}}\)). 1. CorRES is also used to simulate plant-level weather data at the location of the reference WF. Wind speeds are available in 5 min resolution.
The area and frequency control model of the DTU Balancing Tool Chain is not part for the scenario simulations that are part of the FarmConners market showcases.
Simulation of aggregate and plant-level VRE in CorRES
The VRE time series simulations for the scenarios are carried out using the DTU Correlations in Renewable Energy Sources (CorRES) simulation tool (Koivisto et al., 2019). CorRES simulations are based on the meteorological data described in Nuno et al. (2018). With pan-European coverage, the weather data provides aggregate (country-level or regional level) time series for the large-scale energy system modelling. The Balmorel energy system model (Wiese et al., 2018) is used for the scenarios presented in this paper; the framework of using CorRES and Balmorel is described in (Gea-Bermudez et al., 2020).
In addition to the aggregate time series presented in the following sections, CorRES is used to give weather data for the reference WF. These weather time series are correlated with the aggregate time series (e.g., DA prices), because they are an output of the same underlying weather data. The weather data represents the average value for the central point of the TC-RWP.
Wind variations may be smoothed because of spatial and temporal averaging effects in mesoscale models (Larsén et al., 2012). Thus, the stochastic simulation part of CorRES is utilised (Koivisto et al., 2020). Adding the fluctuations provides more realistic variability, and allows sub-hourly simulation of the plant-level wind speeds. Wind speeds with a resolution of 5 min are simulated for the reference WF. Since wind direction variations remain hourly however, showcase results are assumed to represent an upper bound of attainable benefits.
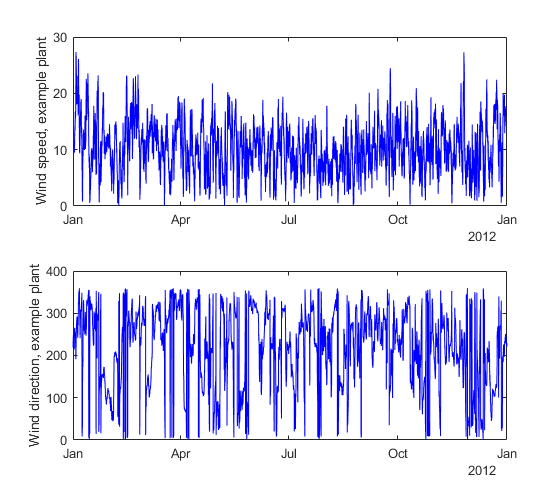
Simulated wind speed and direction at the location of the reference WF.
Simulated wind speed and direction for the reference WF are shown in the above figure for the selected weather data year of 2012. Due to its relevance for WFFC with its high thrust, hence stronger wake effects, the wind speed region of 6 – 12 m/s will be considered for the showcases. The corresponding wind rose for that region, including the frequency of occurrence within the meteorological year shows that the majority of the inflow data included in the showcases is from westerly directions, providing opportunities to investigate the market benefits of WFFC for turbines with cross-wind distances (not fully aligned to the flow).
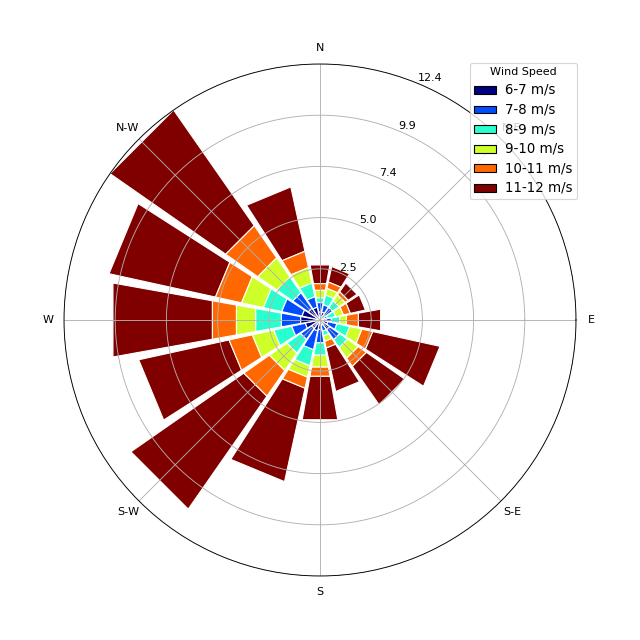
Wind rose, filtered for the wind speed region of interest, at the reference WF.
Simulation of day-ahead markets using OptiSpot
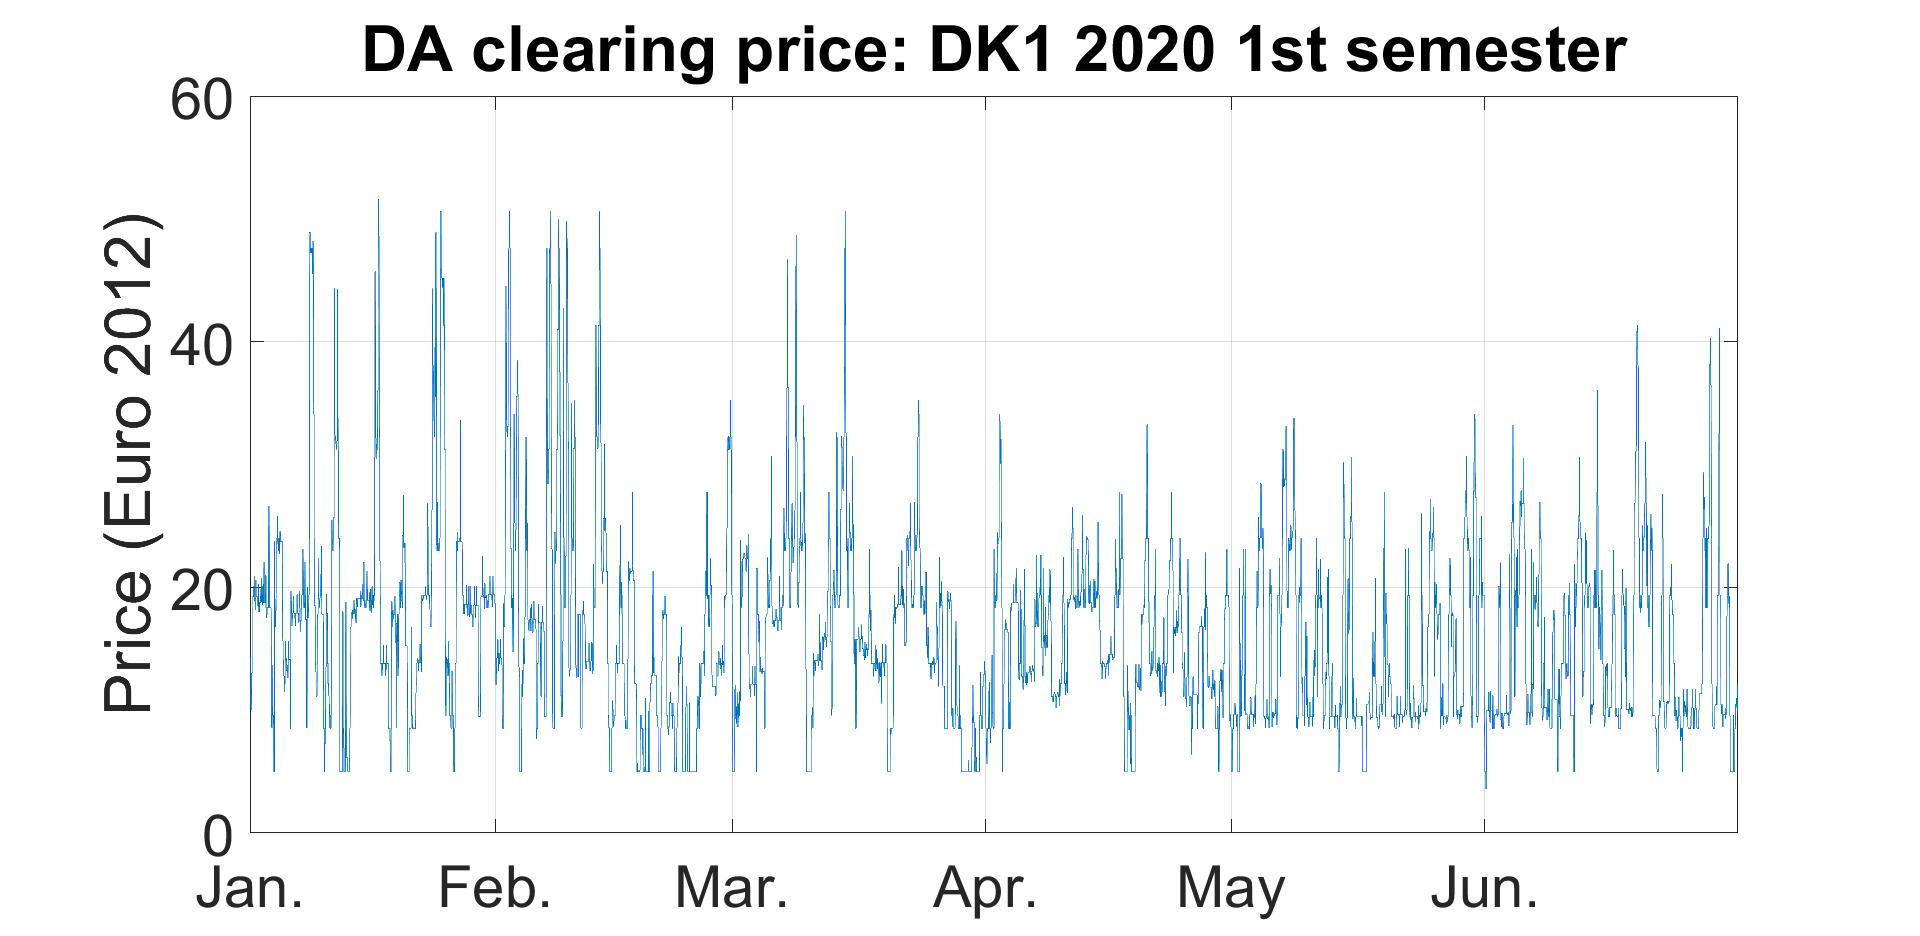
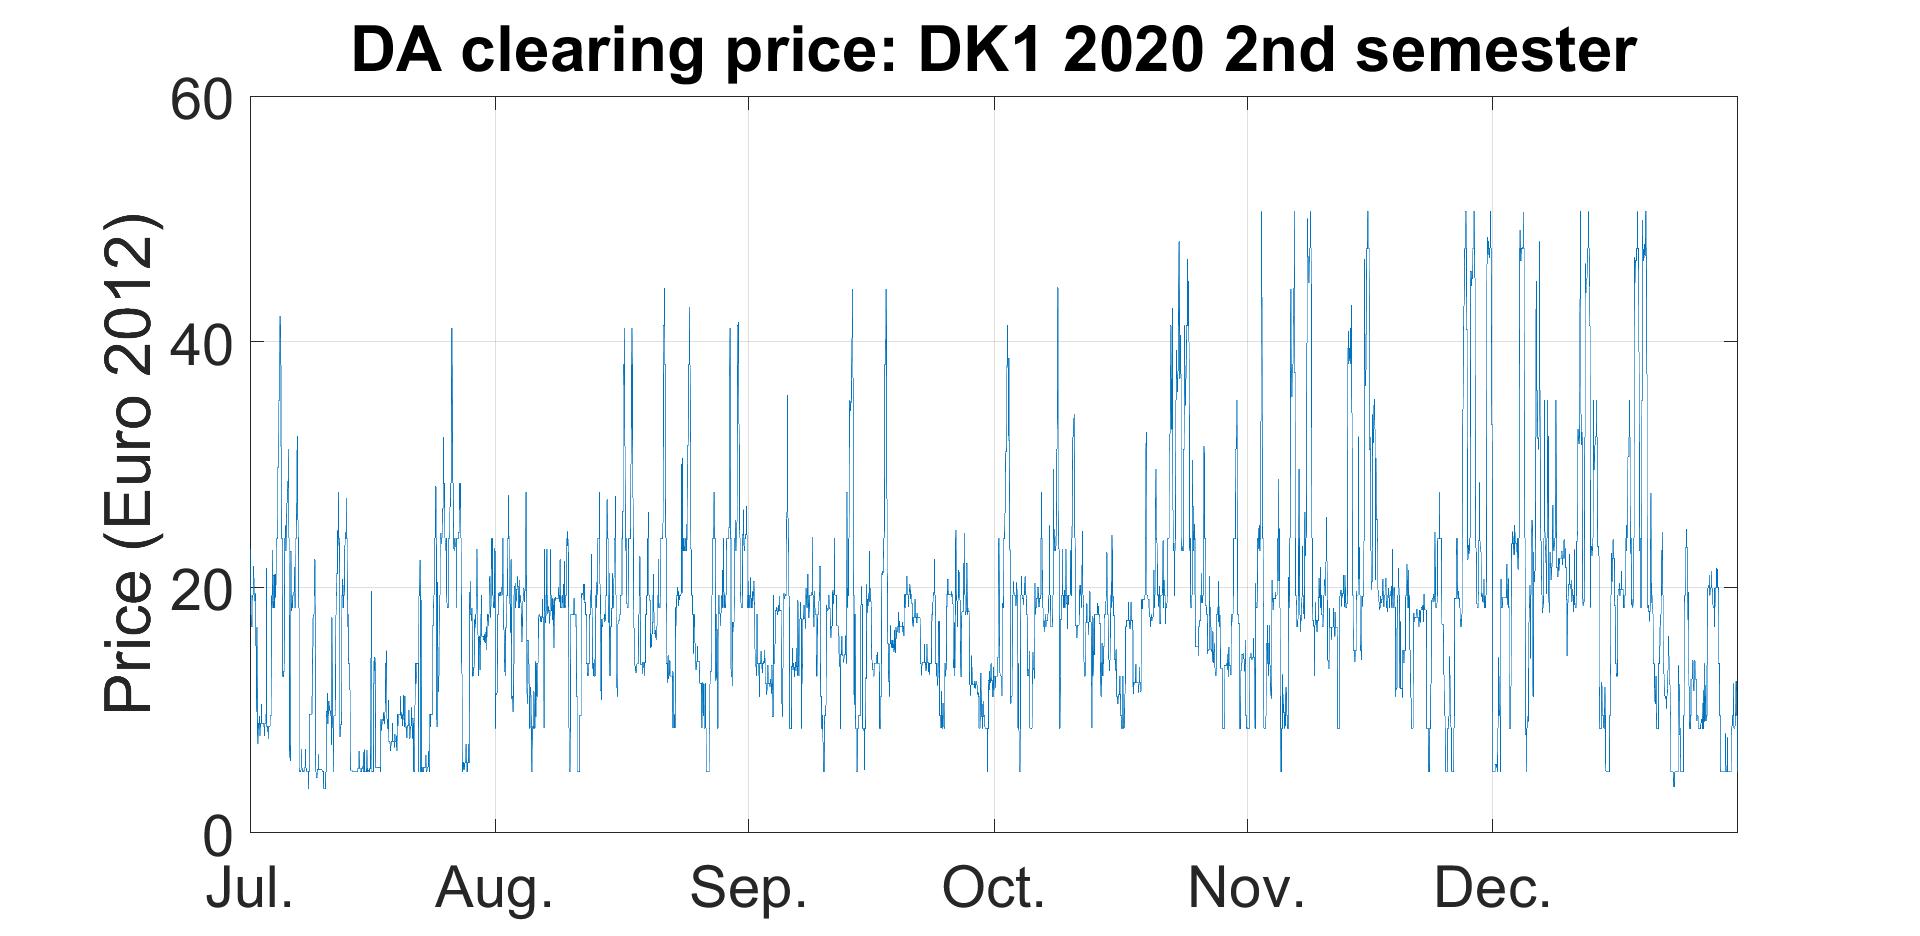
Simulated day-ahead (DA) clearing price time series for the DK1 region in 2020. Prices are in EUR 2012 value since the considered meteorological data is from 2012.
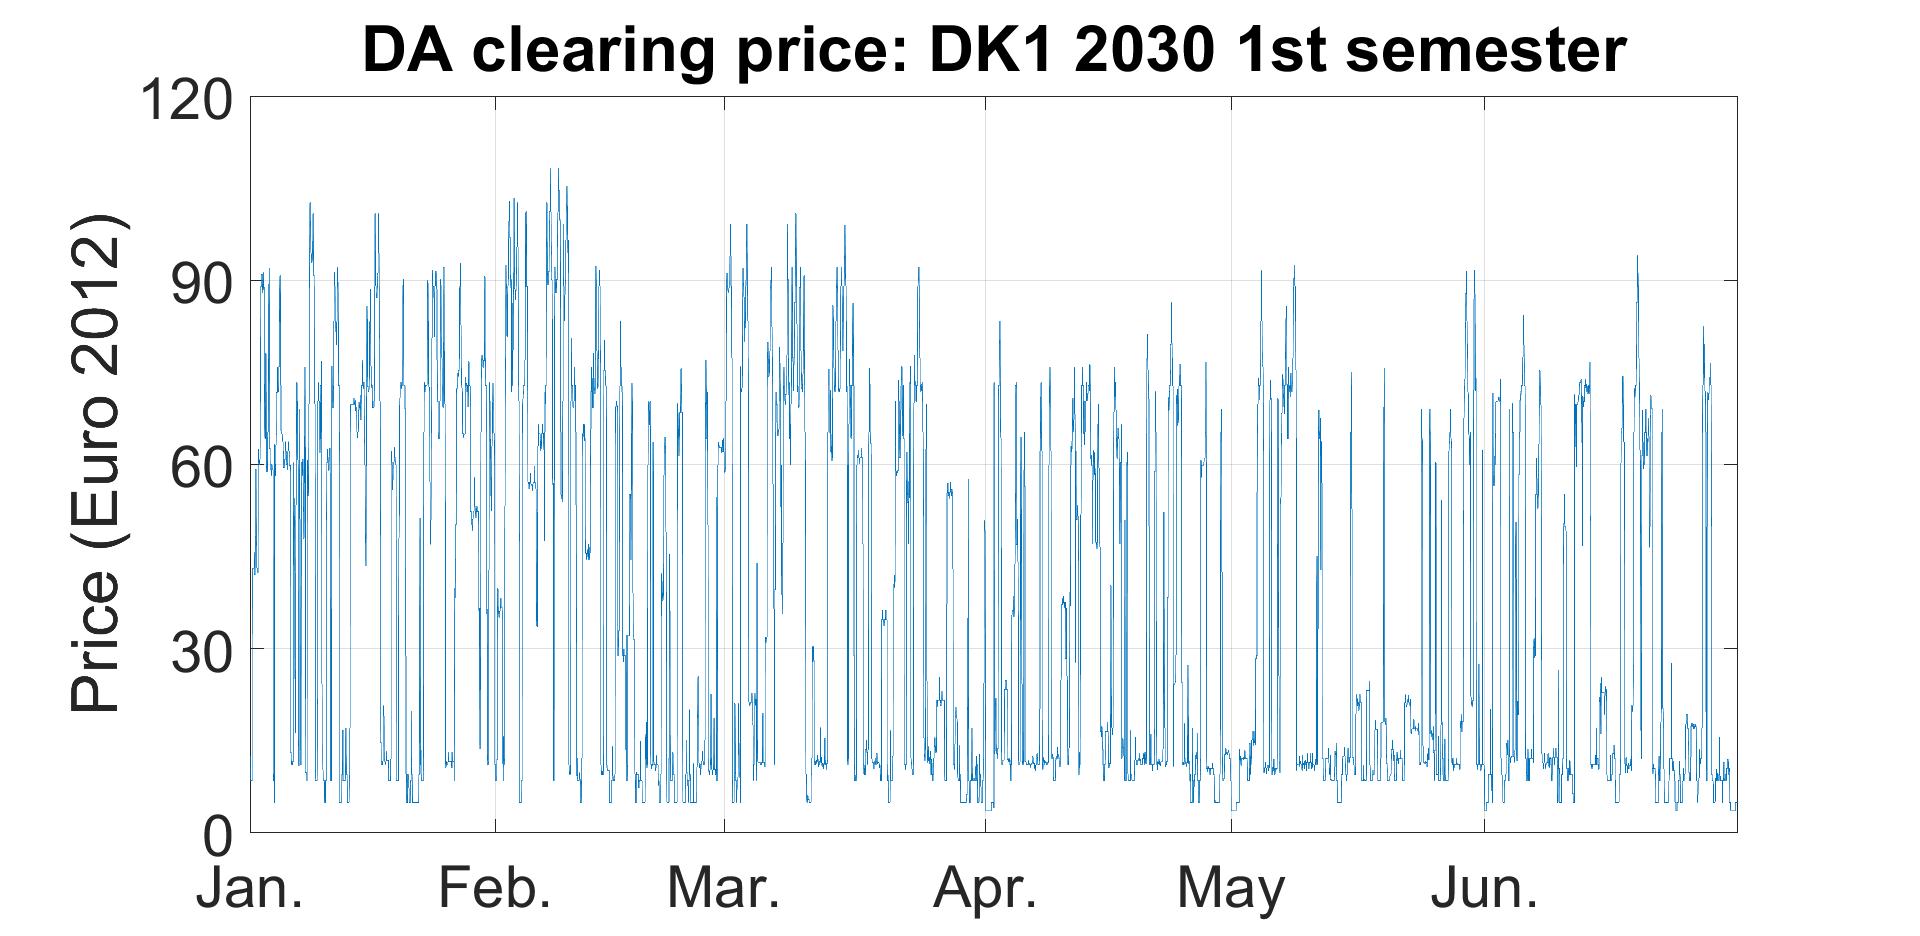
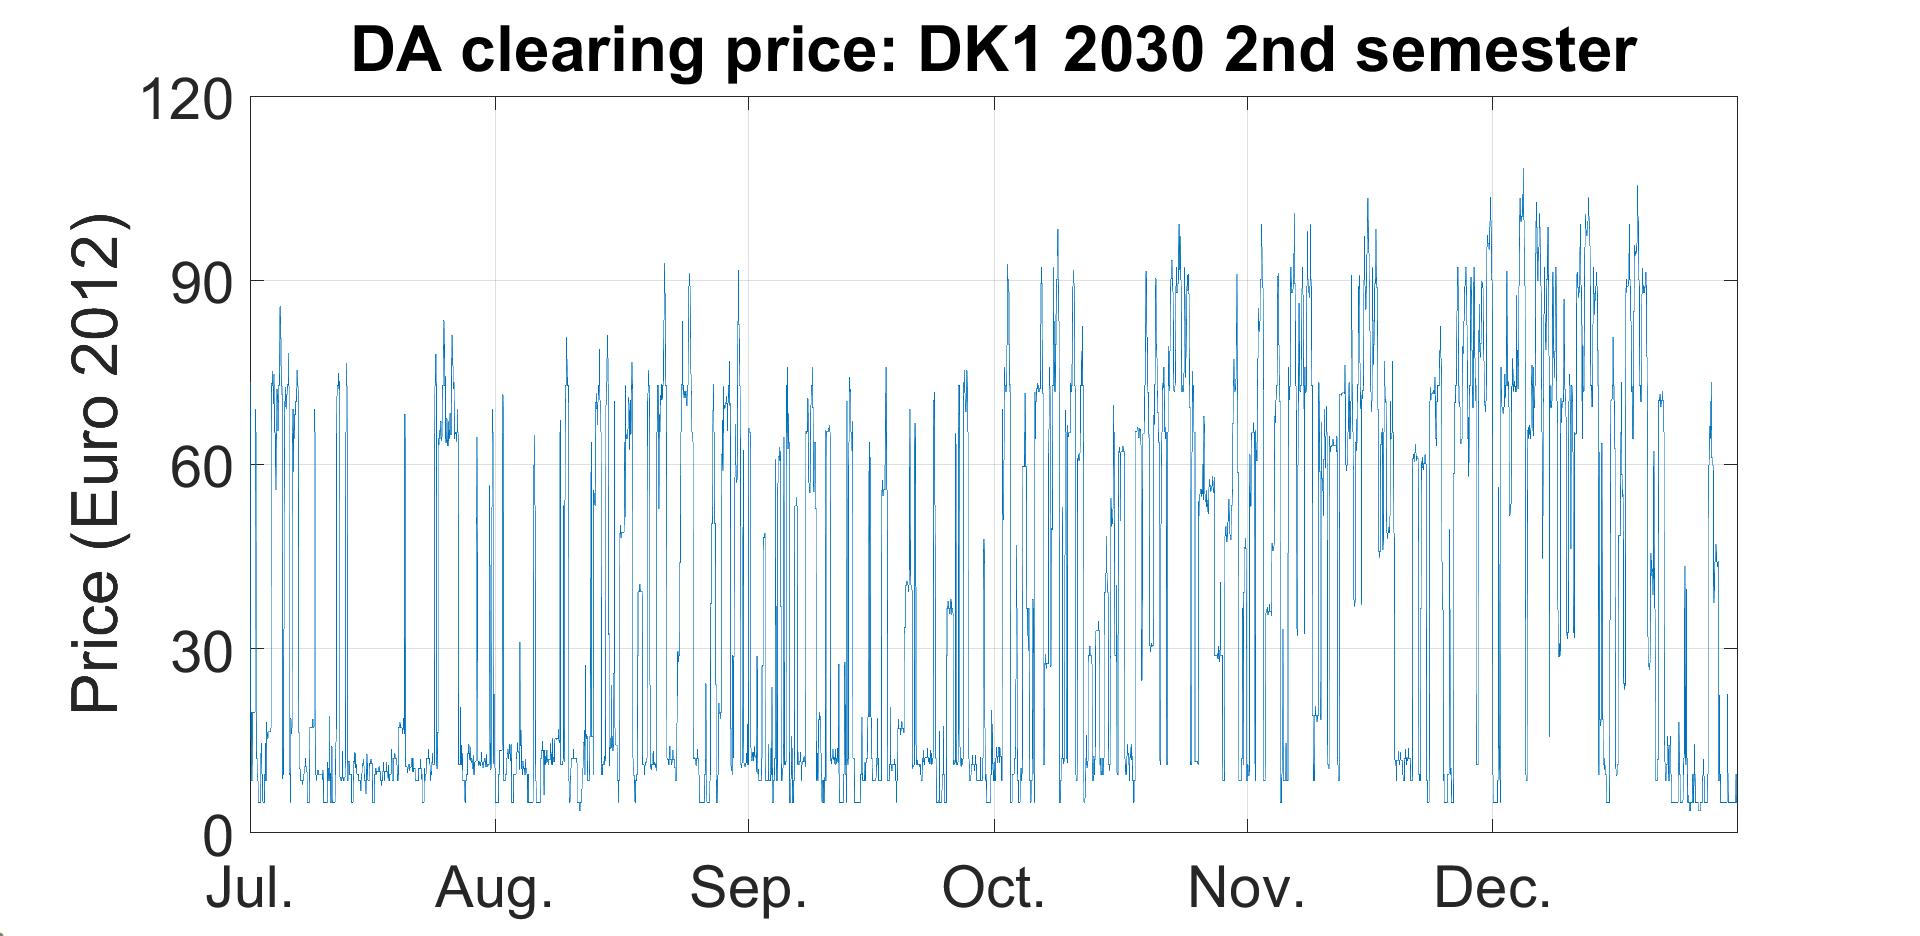
Simulated day-ahead (DA) clearing price time series for the DK1 region in 2030. Prices are in EUR 2012 value since the considered meteorological data is from 2012.
Simulations of the day-ahead market are performed using OptiSpot in Balmorel. The simulated day-ahead prices in EUR for DK1 in 2020 and 2030 are presented in the figures above. The prices are given at the price level of 2012 because the considered meteorological data is from 2012. It can be observed that the prices vary from approximately 0 EUR/MWh to 40 EUR/MWh in 2020 and to more than 100 EUR/MWh in 2030. This provides justification to control the WF towards maximising revenue from market instead of only maximising energy production. In order to understand the variability of the prices, duration curves for 2020 and 2030 prices are plotted in the Figure below. It illustrates that the electricity price increases and becomes more volatile from 2020 to 2030. This development is caused by the link between the electricity prices and the fees for \(CO_2\) emissions. It is assumed that fossil fuels will still account for a considerable part of the electrical power in 2030 and since the \(CO_2\) price is increasing, electricity prices expand too, resulting in an increased variability of spot market prices.
It is interesting that the price is below 20 EUR 50% of the time, while the price is above 60 EUR for 40% of the time.
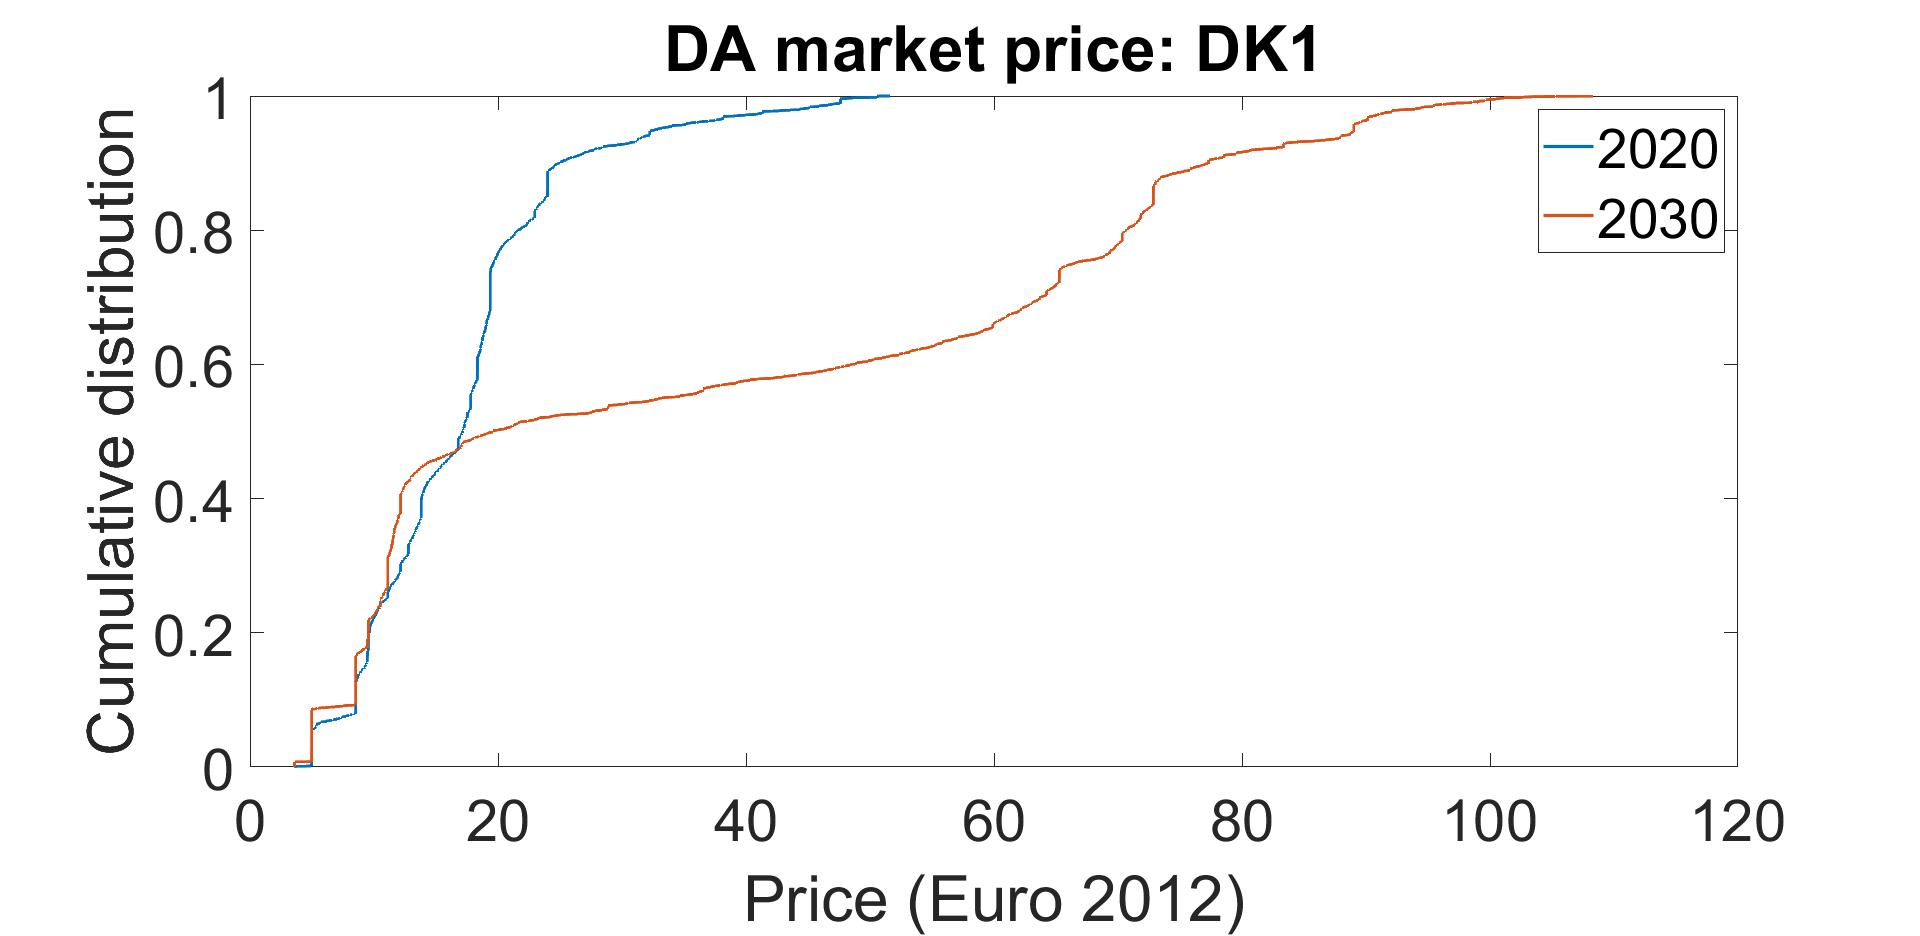
Cumulative distribution of the simulated day-ahead (DA) market clearing price for DK1 region in 2020 and 2030. Prices are in EUR 2012 value since the considered meteorological data is from 2012.
Simulation of balancing markets using OptiBal
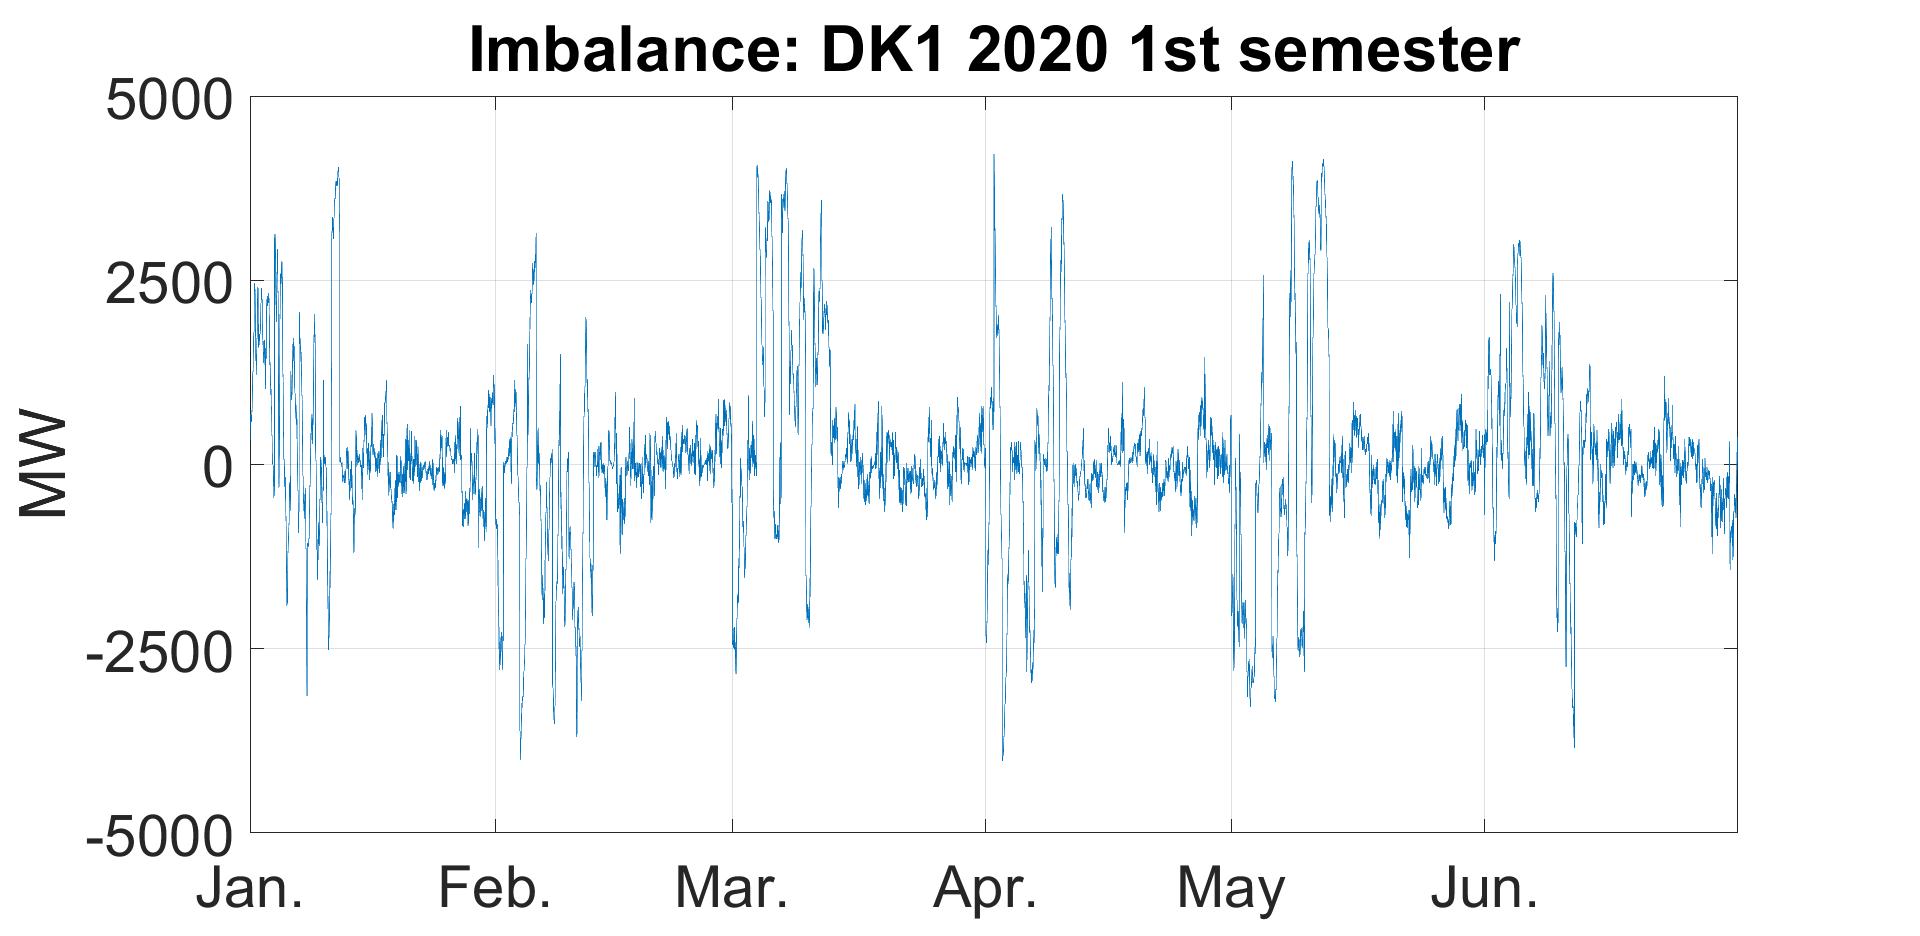
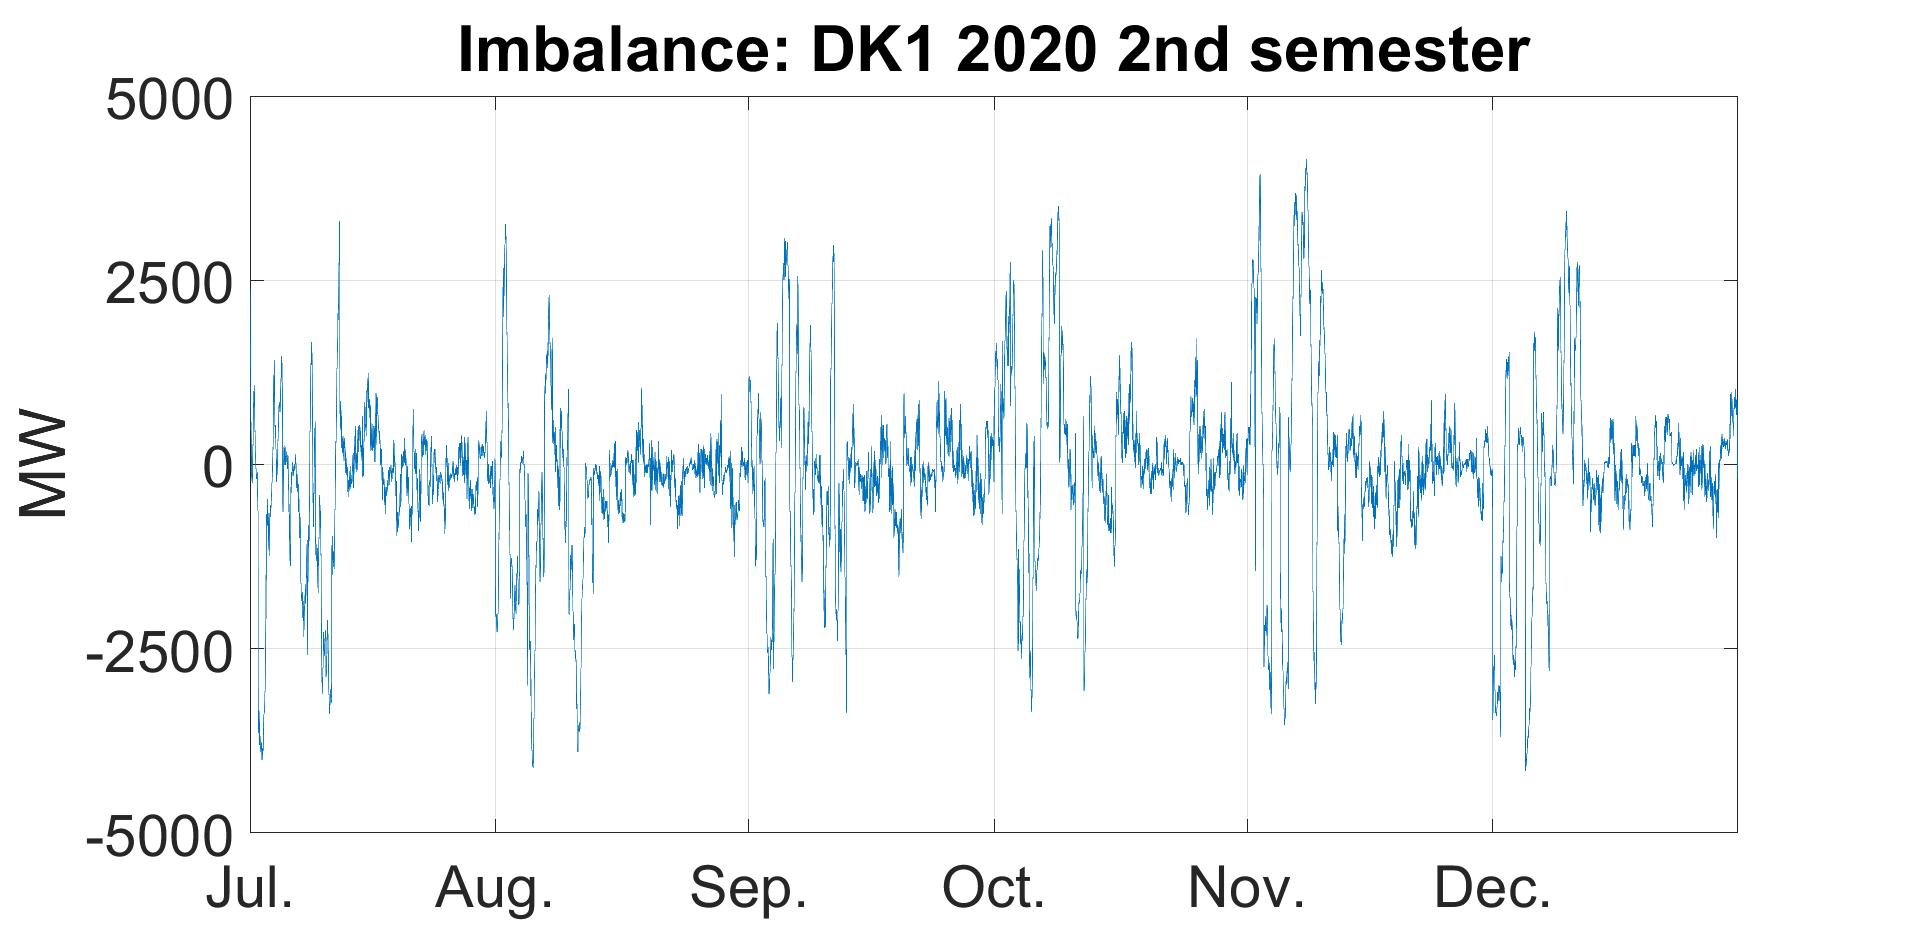
The imbalance before balancing time series for DK1 region in the year 2020.
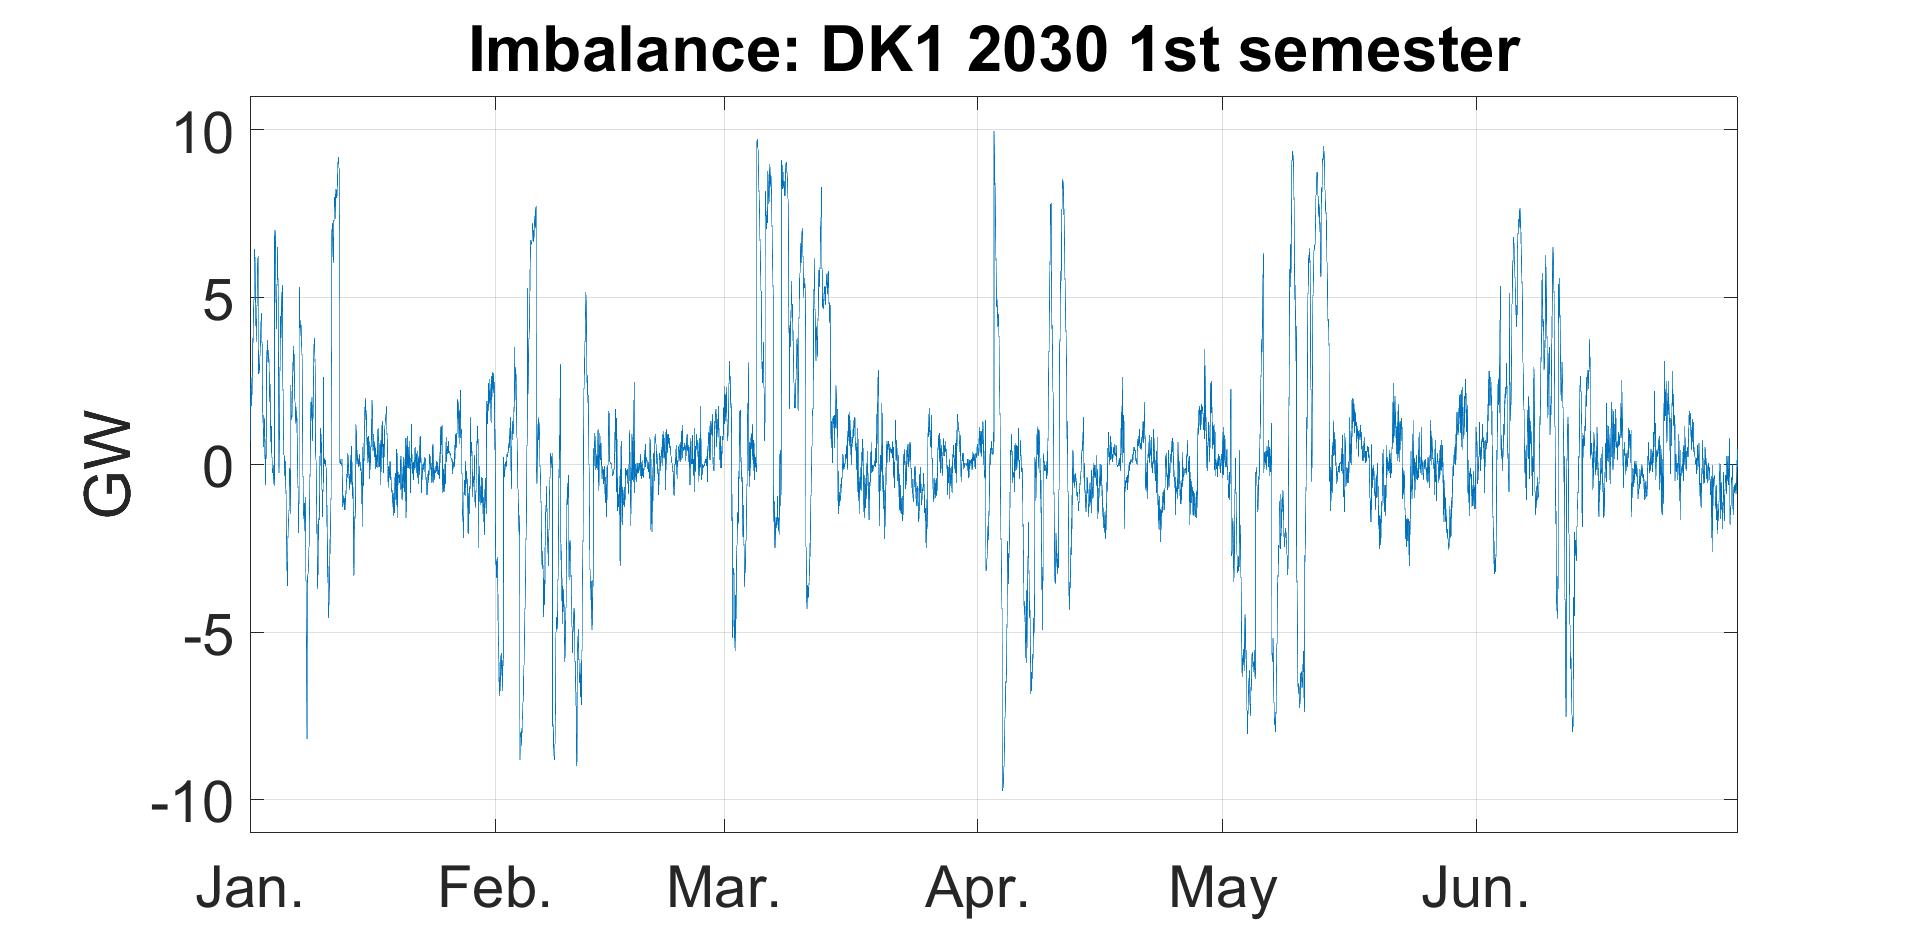
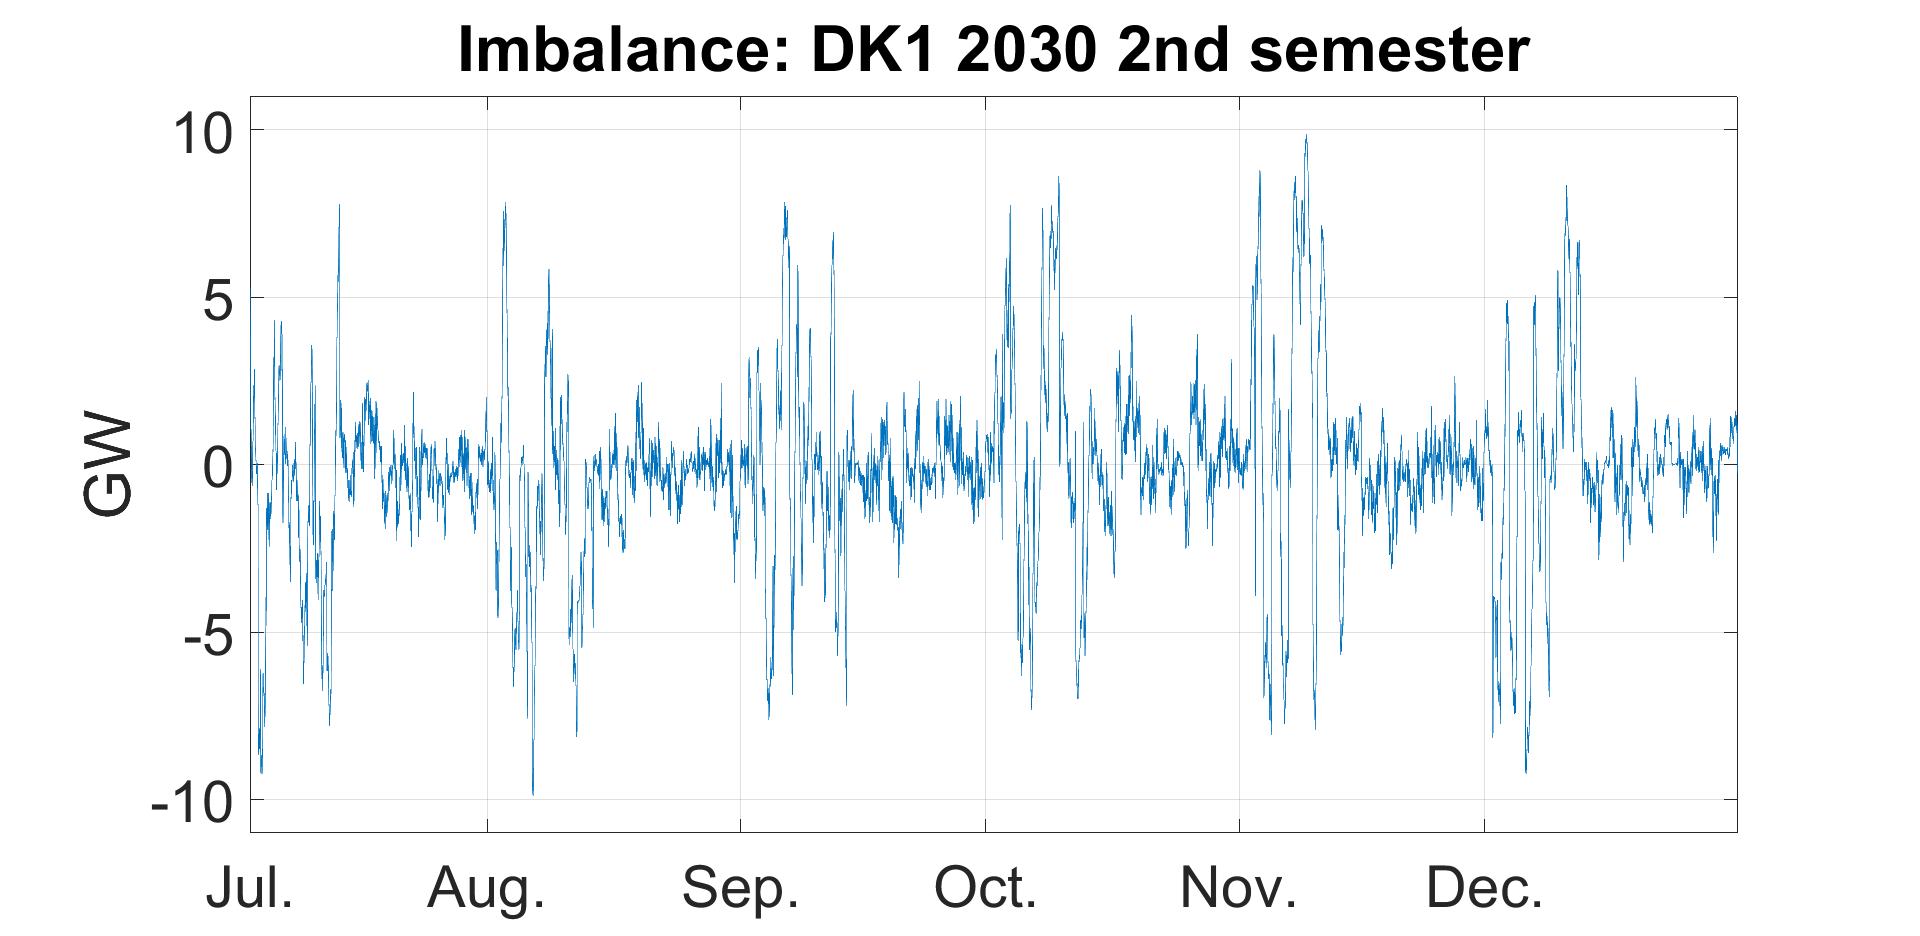
The imbalance before balancing time series for DK1 region in the year 2030.
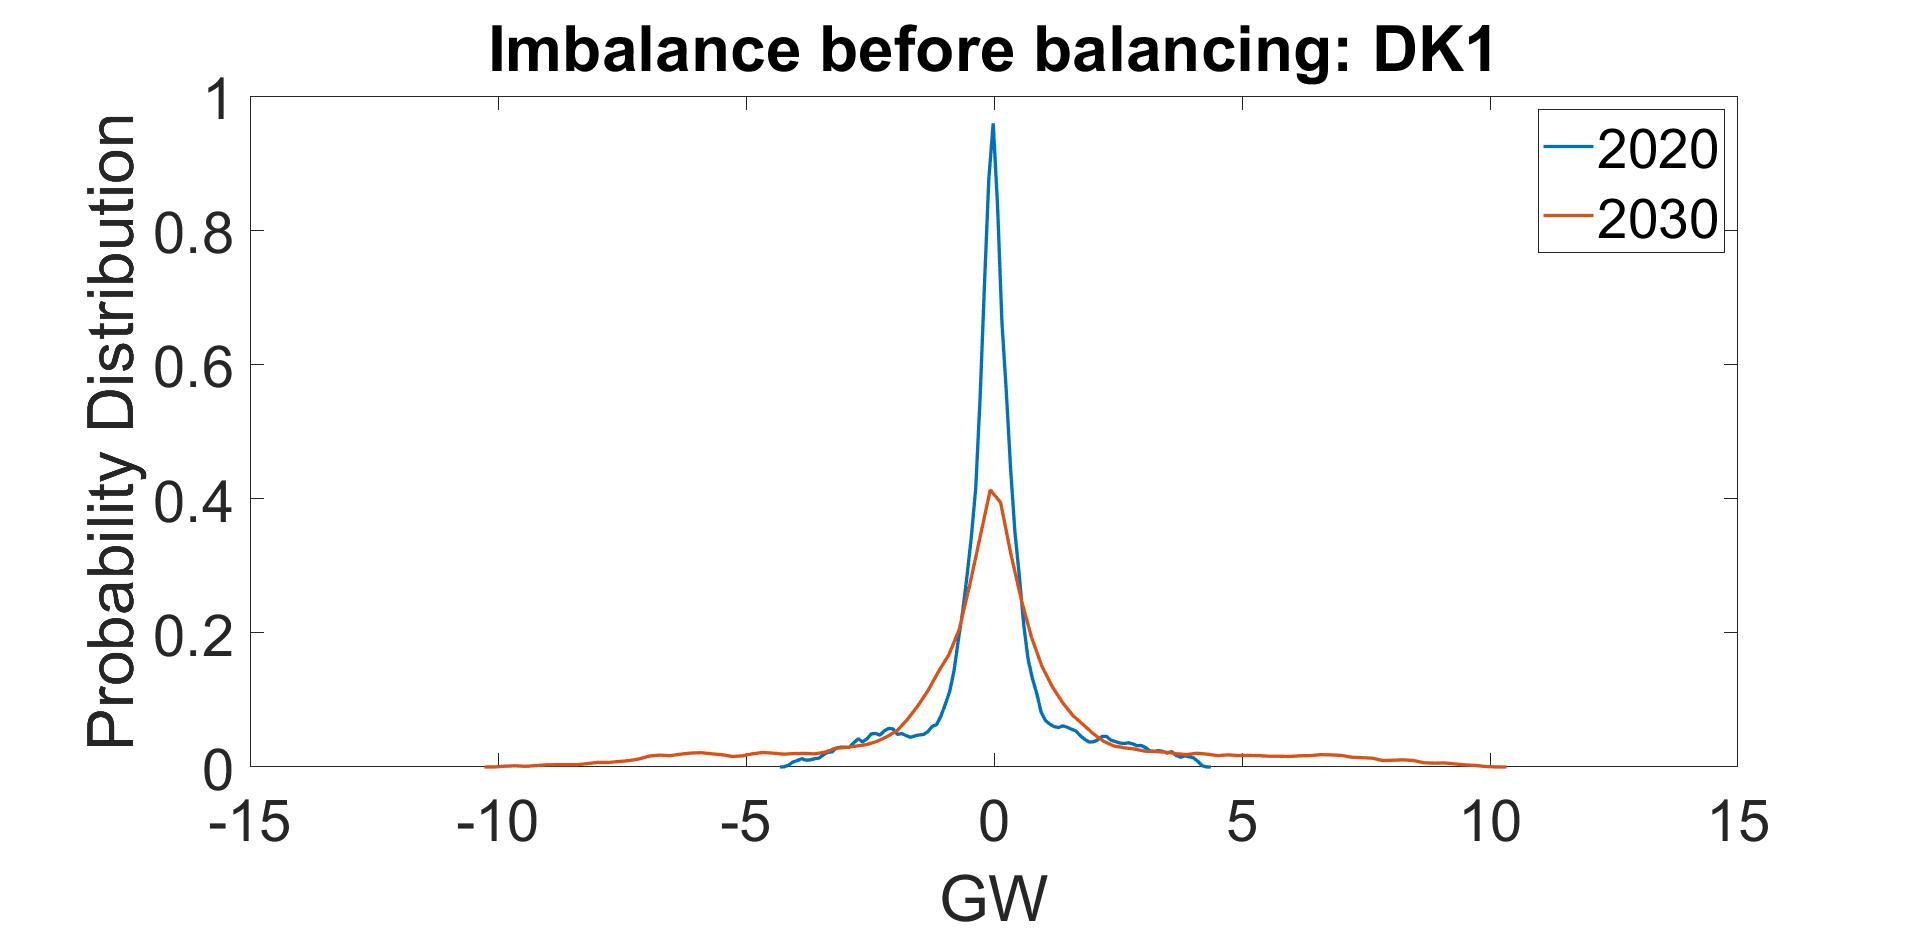
Probability distribution of the simulated imbalances in the DK1 region in 2020 and 2030.
Simulations in OptiBal are used to discuss the potential participation of wind farms in future balancing markets. Hour-ahead imbalances for DK1 are calculated as the differences between DA plan \(P_{sched,DA}\) and HA forecast \(P_{RES,HA}\) of wind power. From the figures above, it can be clearly observed that extreme imbalances (the tails of the probability density functions) increase substantially in the 2030 scenario. This can signify that in the future, when there are few hours with high HA imbalances, WFs might need to play a major role in balancing processes.
In general, the volume of the imbalances is increasing towards 2030 following the increased share of energy generated from wind, which certainly demonstrates the potential of WFC to earn revenue from balancing market.
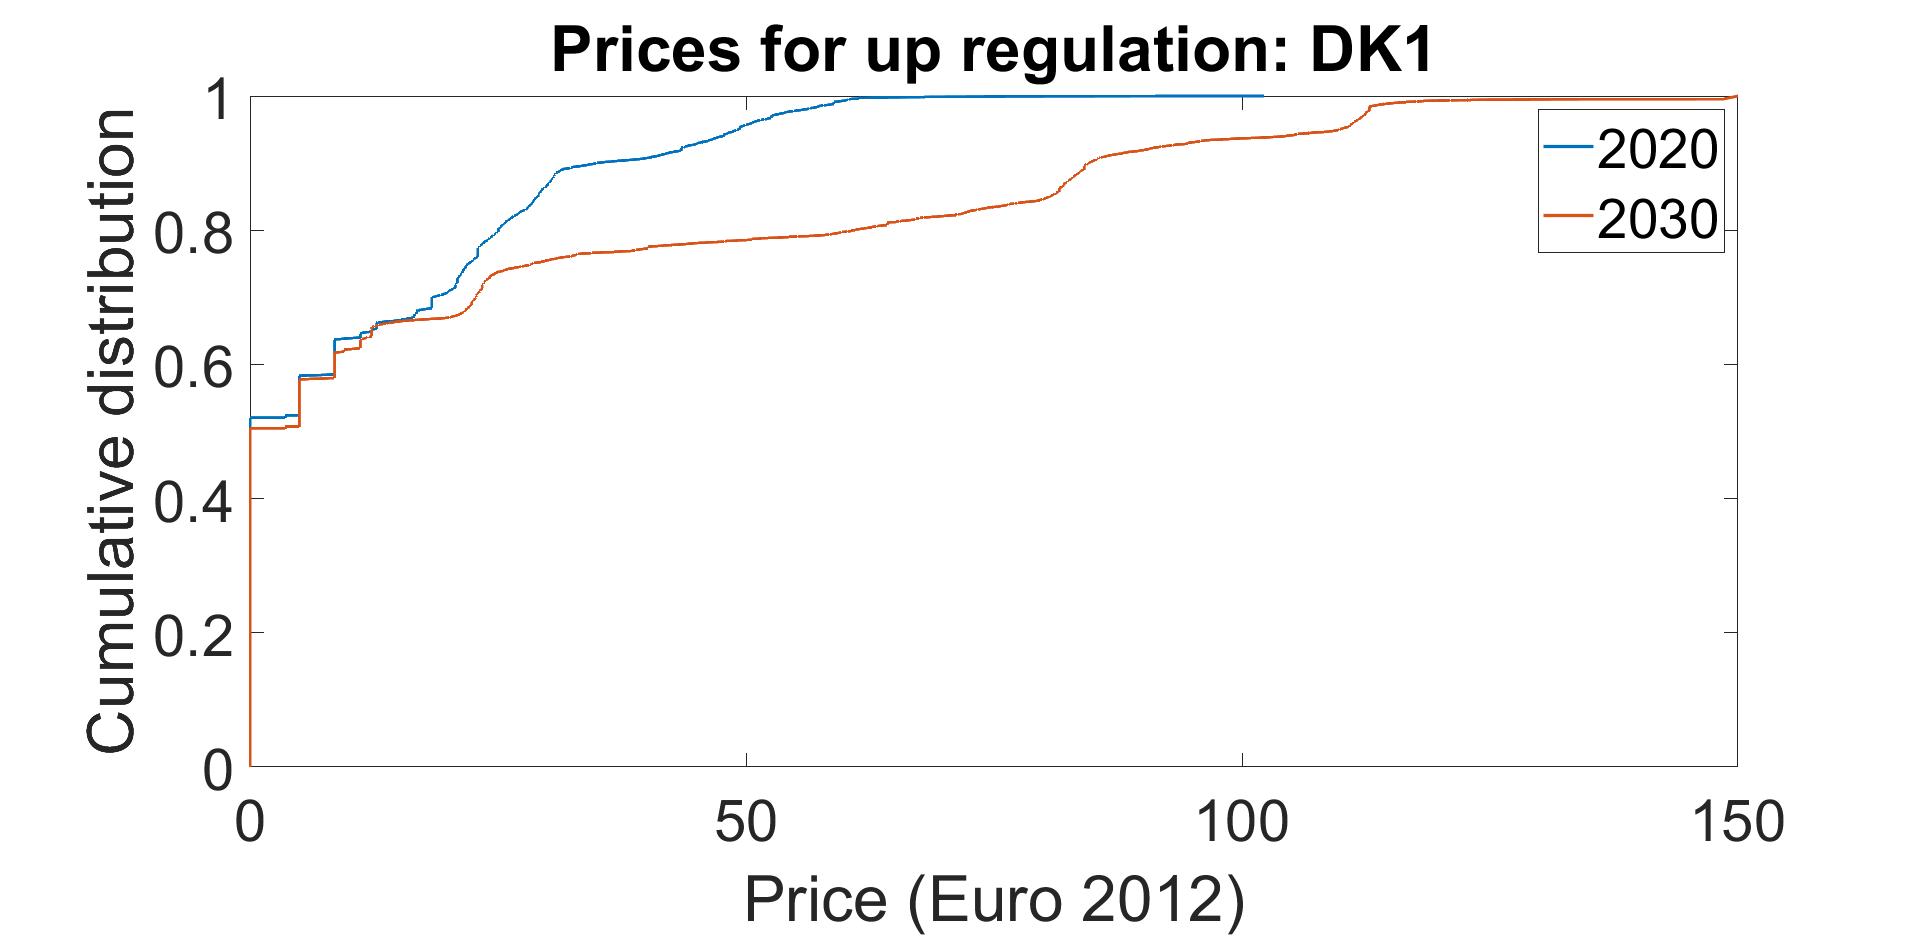
Cumulative distribution of the simulated hour-ahead market price for up-regulation in DK1 region in the years 2020 and 2030. Prices are in Euros (2012 value since the considered meteorological data is from 2012).
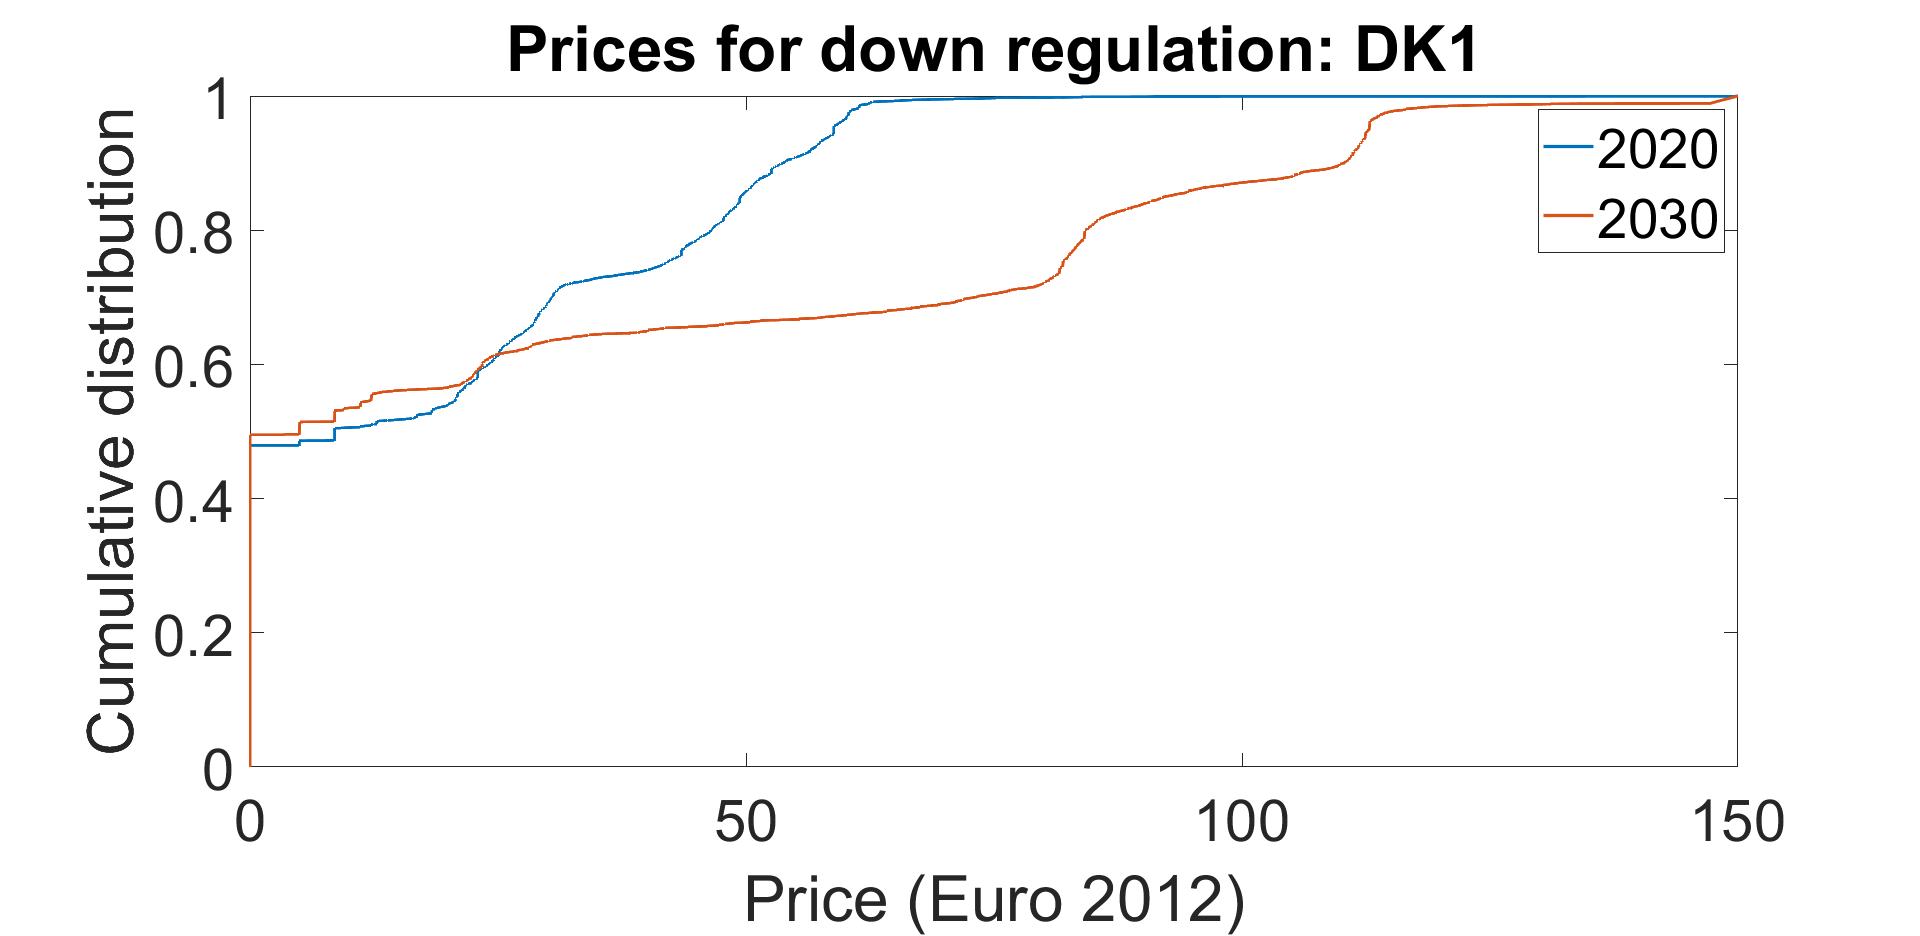
Cumulative distribution of the simulated hour-ahead market price for down-regulation in DK1 region in the years 2020 and 2030. Prices are in Euros (2012 value since the considered meteorological data is from 2012).
During the hour-ahead balancing market, wind generation forecast simulations (which are more accurate than day-ahead) are taken into consideration and thus the day-ahead dispatch schedule is adapted. The generators participating in balancing need to regulate their dispatch level up or down depending on the instantaneous imbalance in the system. The resulting cumulative prices can be seen from the figures above. The prices for up-regulation and down-regulation are substantially increasing, and their volatility is higher in 2030 as compared to 2020.
The simulation procedure to generate the time series for up-regulation and down-regulation prices is as follows:
- Up-regulation: If the WF is already curtailed in DA dispatch, it is possible to up-regulate
- Estimation of up-regulation prices
- Potential amount/volume of up-regulation in MW
- Simulated wind speed and direction, correlated with the price time series
- Down-regulation
- Estimation of down-regulation prices
- Potential amount/volume of down-regulation in MW
- Simulated wind speed and direction, correlated with the price time series