Market Showcases
The showcases are built around the simulated Scenarios by considering perfect short-term forecasts, sensor measurements, etc. Three showcase sets are differentiated as:
- High electricity prices
- Low electricity prices
- TSO-driven
The showcases are constructed around the assumption that the increasing share of wind power and flexible electricity prices will provide more pronounced incentives to include additional objectives in WFC than today. For example, electricity prices below the production costs provide a strong incentive to curtail the operation and consider rather other objectives such as the alleviation of structural loads or noise reduction.
Showcases for high and low prices are constructed by binning of the simulated price data. This is to quantify statistical overview of the potential revenue increase via WFFC per wind speed and direction sectors. The region of interest for wind speed is 6 - 12m/s, and the data is classified within \(\pm1\,m/s\) bins. The wind direction sectors are divided into \(\pm15^\circ\) for both the low and high price scenarios.
For the FarmConners showcases, only the DA prices are included. Especially in the long term, i.e. for 2030 scenarios, it might be increasingly relevant to include balancing prices as they are expected to increase further and have a bigger share in the revenue generation for wind power plants. Accordingly, the balancing price time series are included in the data package that is released as a part of the FarmConners showcases, although not included in the market showcases themselves for simplicity. The prices included in the showcases are grouped according to the quartiles in the respective distributions. The high electricity prices include the top quartile, i.e. the highest 25% of the 2020 and 2030 scenarios, whereas the low electricity prices include the second lowest bin to avoid zero prices enabling to report a positive income (and potentially gain as a performance indicator) as a part of the showcases.
High Electricity Prices
For the simulated day-ahead (DA) prices in Simulation of day-ahead markets using OptiSpot, the highest 25% of the 2020 and 2030 DA prices are collected. The corresponding weather data is included in the data package to be distributed.
2020 High Prices
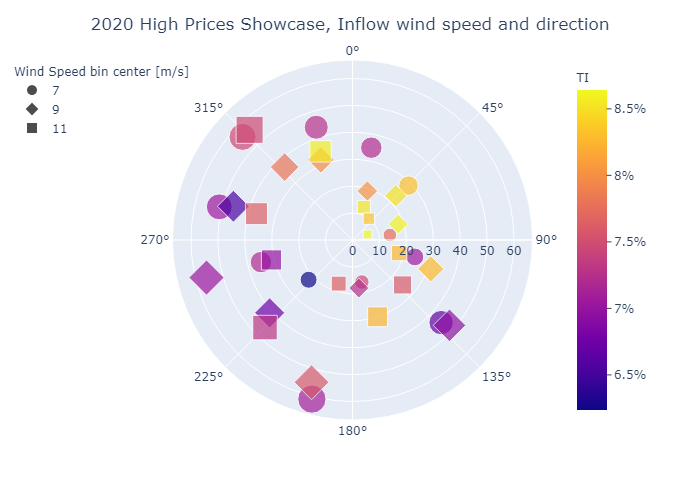
2020 High Prices Showcase overview of the meteorological data. The symbols show the wind speed bins (\(\pm1\,m/s\)) in the region of interest for WFFC. The colour indicates the ambient turbulent intensity (TI) levels per wind direction sector (\(\pm15^\circ\)). The frequency on the x-axis refers to the number of hourly samples available for particular inflow case within the market showcase.
2030 High Prices
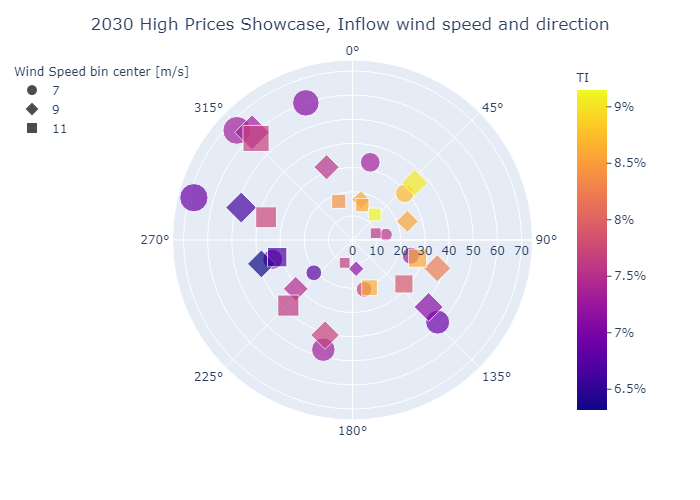
2030 High Prices Showcase overview of the meteorological data. The symbols show the wind speed bins (\(\pm1\,m/s\)) in the region of interest for WFFC. The colour indicates the ambient turbulent intensity (TI) levels per wind direction sector (\(\pm15^\circ\)). The frequency on the x-axis refers to the number of hourly samples available for particular inflow case within the market showcase.
Low Electricity Prices
For the simulated day-ahead (DA) prices in Simulation of day-ahead markets using OptiSpot, the lowest 25% to 50% of the 2020 and 2030 DA prices are collected. Note that the lowest 25% quartile is avoided for the final showcase as it includes many zero-prices region in which the revenue maximization would be non-trivial. The FarmConners consortium suggests inclusion of storage and hybrid power plants for realistic and feasible low price revenue management - which is not included in this version of the Market showcases. The corresponding weather data is included in the data package to be distributed.
2020 Low Prices
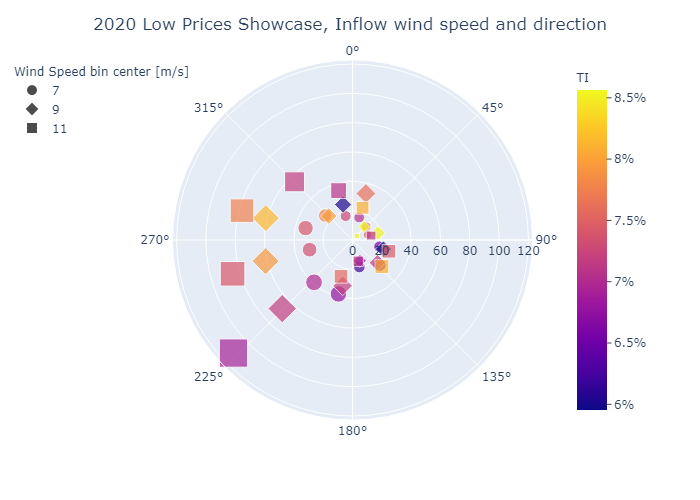
2020 Low Prices Showcase overview of the meteorological data. The symbols show the wind speed bins (\(\pm1\,m/s\)) in the region of interest for WFFC. The colour indicates the ambient turbulent intensity (TI) levels per wind direction sector (\(\pm15^\circ\)). The frequency on the x-axis refers to the number of hourly samples available for particular inflow case within the market showcase.
2030 Low Prices
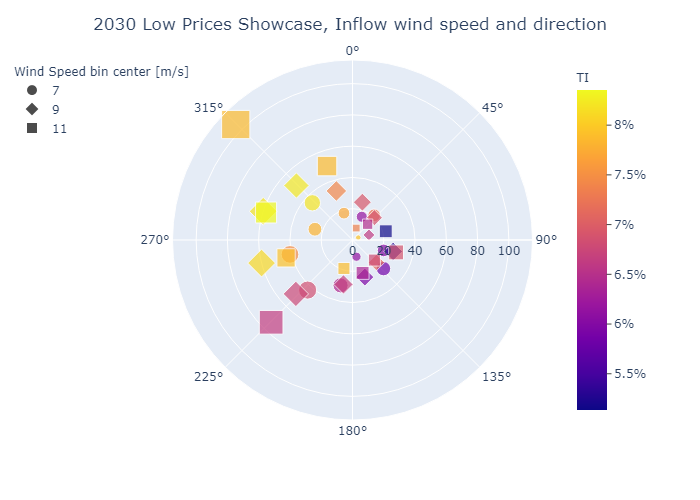
2030 Low Prices Showcase overview of the meteorological data. The symbols show the wind speed bins (\(\pm1\,m/s\)) in the region of interest for WFFC. The colour indicates the ambient turbulent intensity (TI) levels per wind direction sector (\(\pm15^\circ\)). The frequency on the x-axis refers to the number of hourly samples available for particular inflow case within the market showcase.
TSO-driven
In TSO-driven operation, an external signal is sent by the system operators (TSO/DSO) to reduce the active power output and operate in either balance-control or delta-control modes. Generally, balance control is used when the hosting capacity of the grid is reduced, while delta control is generally activated when WFs are down-regulated to provide power reserves. Possible causes for TSO-driven curtailment include:
- Congestion in the system
- System disturbance, e.g. faults in the grid
Compensation for the loss of production is either not provided or based on the agreement with the TSO, and thus, no time series for prices are required for that. The weather time series have however, been provided.
TSO-driven FarmConners market showcase requires Maximum 75% of the rated capacity of the reference wind farm TC-RWP (see Reference Wind Farm) for the given hourly weather time series for July and August as inflow as seen in Simulation of aggregate and plant-level VRE in CorRES.